
CompassIQ
CompassIQ is a proprietary scoring system that quantifies a brand’s ability to convert prospects into long-term Brand Advocates. ‘Brand Advocates’ are defined as customers that buy from a brand on their own volition exhibiting a regular repeat buying habit over time and advocate on behalf of the brand by recruiting new customers.
The reporting and analysis are the result of research that spans more than two decades. The work includes hundreds of qualitative and quantitative field studies featuring thousands of interviews conducted with consumers across fashion, wellness, personal care, outdoor, sustainability, beauty, food & beverage, skincare, and fitness.
The objective has always been the same thing: To determine a singular measurement of performance creating Brand Advocates, providing a diagnosis of exactly what to do to improve and where to allocate resources to maximize impact.
Unique Features
01. Proprietary Measurements across critical dimensions such as:
Migration Rate™ Ratio: Movement of customers through loyalty tiers.
Revenue Distribution Ratio: Allocation of revenue across customer segments.
Advocacy Continuity: Retention and maintenance of top-tier loyalists.
02. Customer Loyalty Metrics
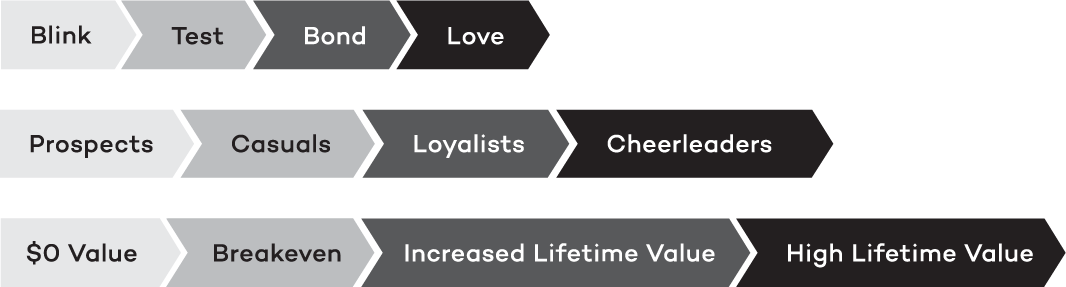
A structured framework classifying customers into four tiers: Prospects, Casuals, Loyalists, and Cheerleaders.
Tracks customer progression through these stages and measures Migration efficiency.
Highlights the behavioral journey, including:
Initial testing (Casuals)
Loyalty building (Loyalists)
Long-term advocacy (Cheerleaders)
03. Focus on Advocacy and Retention
Prioritizes fostering brand advocates as a key profitability driver.
Uses proprietary metrics like "Advocacy Continuity™" to measure retention and regression rates of loyal customers.
04. Profit Opportunity Insights
Quantifies unrealized profit potential due to suboptimal customer Migration and retention rates.
Suggests targeted improvements, such as better Migration efficiency or customer experience optimization.
05. Behavioral Progression Analysis
Tracks specific purchase behaviors (e.g., zero purchases, single purchase, multiple purchases) to identify transition barriers between customer tiers.
Includes data on retention, attrition rates, and progression probabilities.
06. Segment-Specific Diagnosis
Detailed analysis of each customer segment:
Casuals: Newly engaged customers testing the product and brand value proposition.
Loyalists: Multi-buyers vetting brand integrity.
Cheerleaders: Fully engaged advocates with fully actualized repeat buying habits.
Identifies areas for optimization within each segment (e.g., improving loyalty for Casuals).
07. Monetary Value Analysis
Breaks down profit contributions per customer segment.
Calculates individual net value, accounting for COGS, acquisition, and retention costs.
Identifies priority profit opportunities between segments.
08. Actionable Recommendations
Provides a roadmap for improving metrics like Migration Rates, segment profitability, and customer retention.
Suggests aligning customer experience strategies with the Customer Activation Cycle.
Comparison to Other Tools
While other CRM tools and data analytics dashboards such as Salesforce, Marketing Cloud, Triple Whale, or Mixpanel emphasize analytics and tactical purchase data, CompassIQ offers a more comprehensive view by integrating:
Financial outcomes (profit and revenue potentials).
Advocacy-focused metrics.
Behavioral progression tied to loyalty stages.
Pinpointed customer engagement failure points.
Proprietary category benchmarks as performance standards.
This makes the Analysis particularly useful for brands aiming to quantify and enhance the emotional and financial value of their customer relationships.
CompassIQ is the first and only means of defining optimal performance benchmarks across multiple metrics that measure a brand’s ability to turn prospects into long-term Brand Advocates ("Cheerleaders"). The following outlines the proprietary benchmarks utilized by CompassIQ:
Key Benchmarks for Optimal Performance
01. Migration Rate Ratio
The percentage of customers progressing through loyalty tiers (Prospects → Casuals → Loyalists → Cheerleaders).
Optimal Benchmark: Migration Rates should meet or exceed thresholds for Advocacy Continuity.
Example: A high proportion of Casuals converting into Loyalists and Loyalists into Cheerleaders.
02. Customer Segment Ratio
Distribution of customers across the four loyalty tiers:
Prospects: Engaging new users.
Casuals: Testing the product/service.
Loyalists: Repeat customers validating the brand.
Cheerleaders: Advocates consistently supporting the brand.
Optimal Benchmark: Balanced distribution with a higher proportion of Loyalists and Cheerleaders to ensure maximizing profitability.
03. Revenue Distribution Ratio
Allocation of total revenue contribution across customer segments.
Optimal Benchmark: Revenue from Loyalists and Cheerleaders should constitute a significant percentage, reflecting the value of retaining high-tier customers.
Example: Loyalists and Cheerleaders contributing the majority of the revenue, while Casuals provide growth opportunities.
04. Advocacy Continuity™
The ratio of customers maintaining or improving their purchase frequency over time versus those attriting or slowing their frequency of purchases.
Optimal Benchmark: Minimal regression from Cheerleaders to Loyalists or from Loyalists to Casuals, with consistent progression through loyalty tiers.
05. Individual Value Ratio
Net value generated by individual customers, calculated as revenue minus cogs, acquisition, and retention costs.
Optimal Benchmark: High net value per Cheerleader and Loyalist, with lower costs to acquire and retain these customers compared to their revenue contribution.
06. Customer Count Balance
Proper ratio of customers in each tier to ensure sustainable growth and profitability.
Optimal Benchmark: Adequate numbers of Loyalists and Cheerleaders relative to Casuals and Prospects, avoiding over-reliance on new customer acquisition.
How CompassIQ Benchmarks Drive Business Value
01. Profitability
Achieving benchmarks maximizes revenue and profit by advancing low loyalty tier customers to become high loyalty tier customers, reducing dependency on paid performance marketing, increasing regular, repeat purchase habits, and increasing advocacy-driven organic growth.
02. Advocacy Continuity Focus
High Advocacy Continuity and Individual Value Ratios reduce dependence on new customer acquisition.
03. Strategic Alignment
Meeting benchmarks provides actionable insights to improve user experience and allocate resources effectively.